



Mapping the Nepal Floods
Posted by Kshitij Sharma • Sept. 16, 2026
Activation record
- 26 August: Flash floods and mudslides hit the Lhende Khola Valley
- 27 Aug: HOT launched the mapping campaign on Tasking Manager. Humanitarian datasets were published on HDX, and Vantor agreed to release imagery.
- 28 Aug: AI-assisted damage assessment was published on HDX.
- 29–31 Aug: Mapping expanded to the lower river corridor at the request of Nepal’s disaster authority (NDRRMA).
- 1 Sep: The first four projects were 100% mapped and validated.
- 2–7 Sep: Four MapSwipe projects opened to validate the AI damage results.
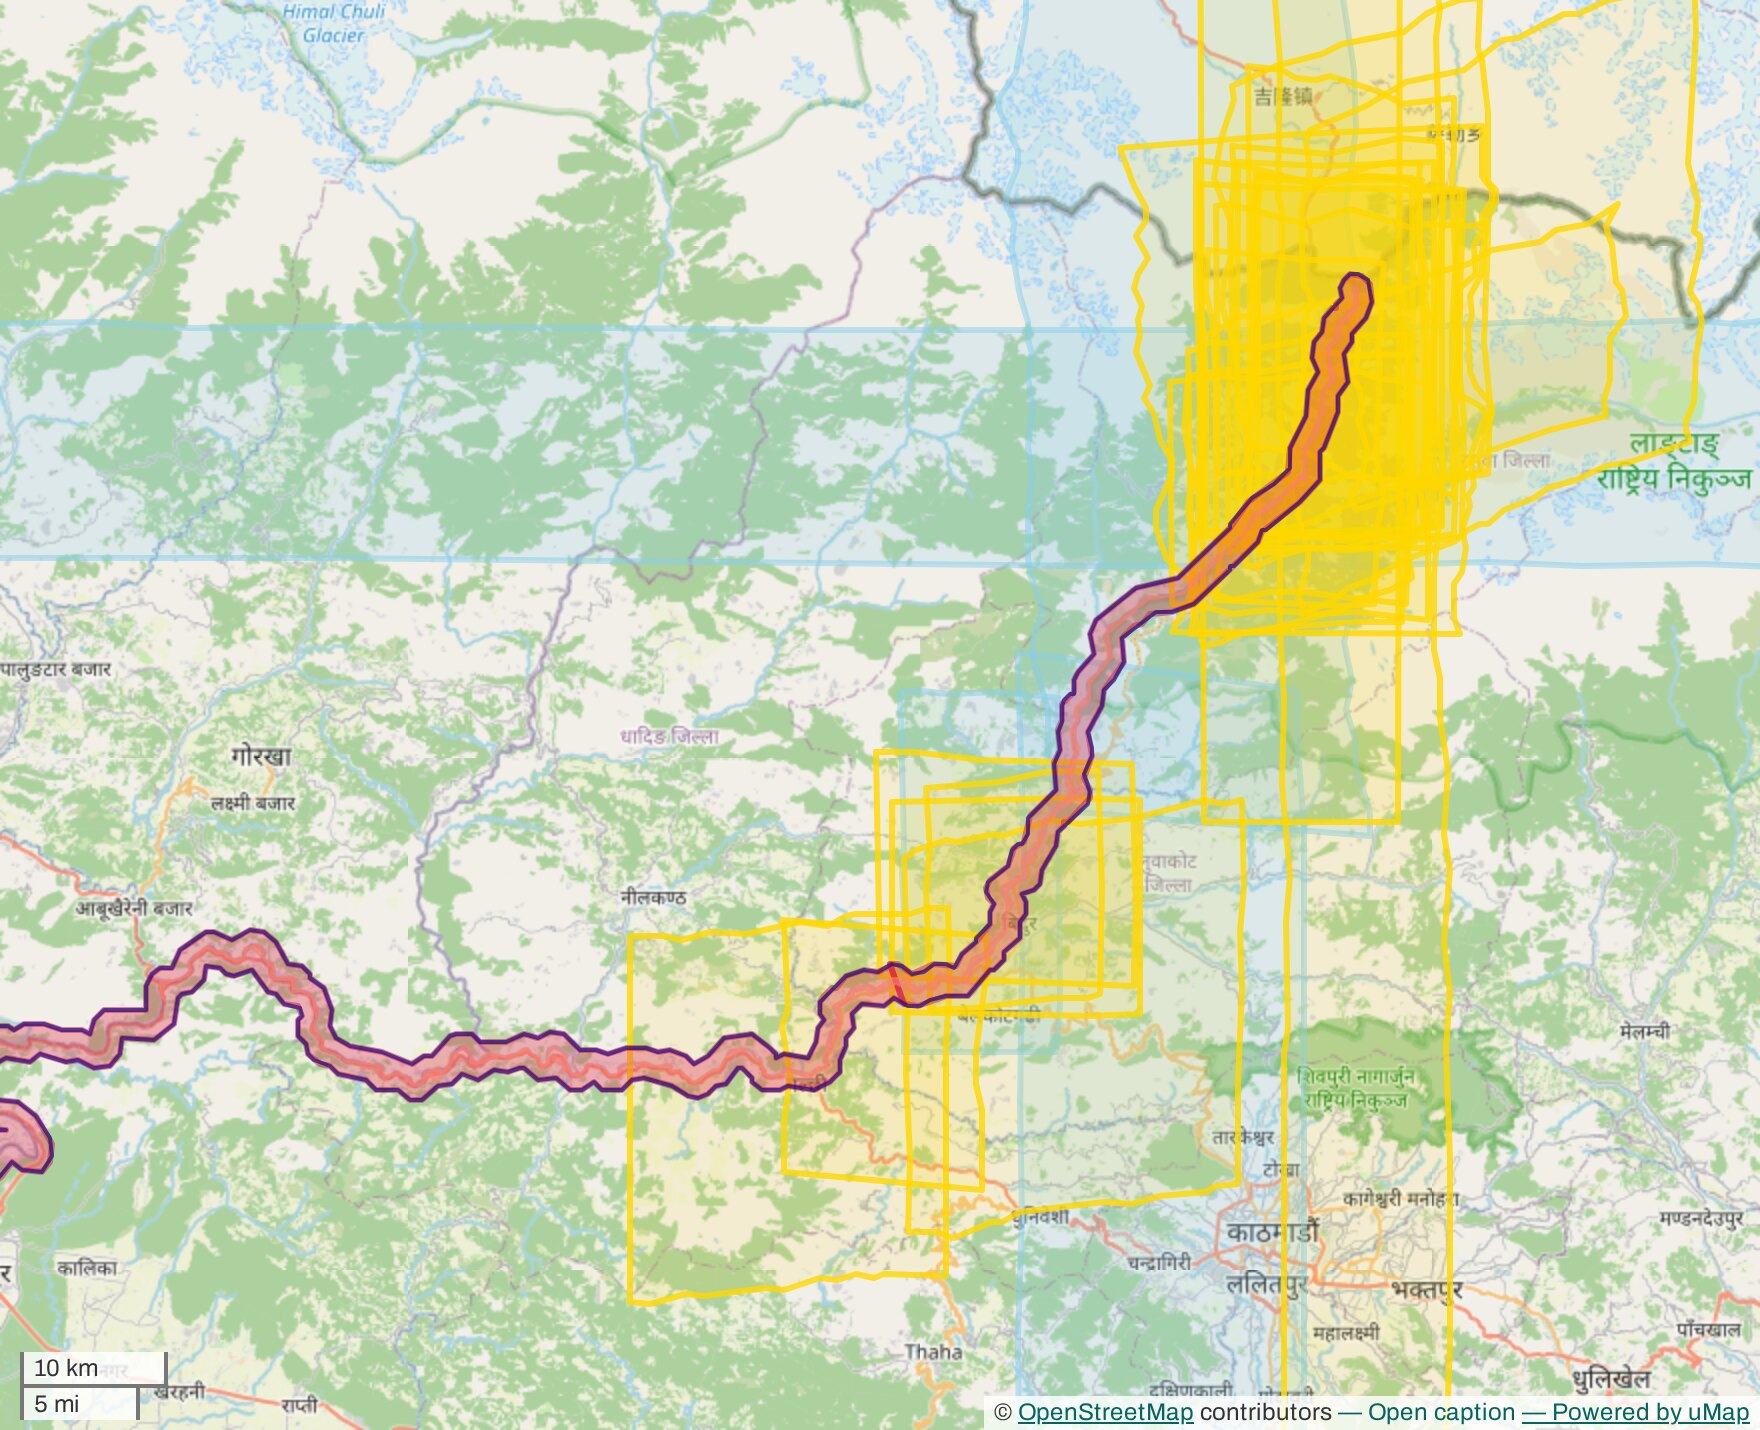
Nepal Floods 2026 map from umap.hotosm.org. Red indicates the observed flood extent on 27 August; yellow indicates post-flood Vantor imagery.
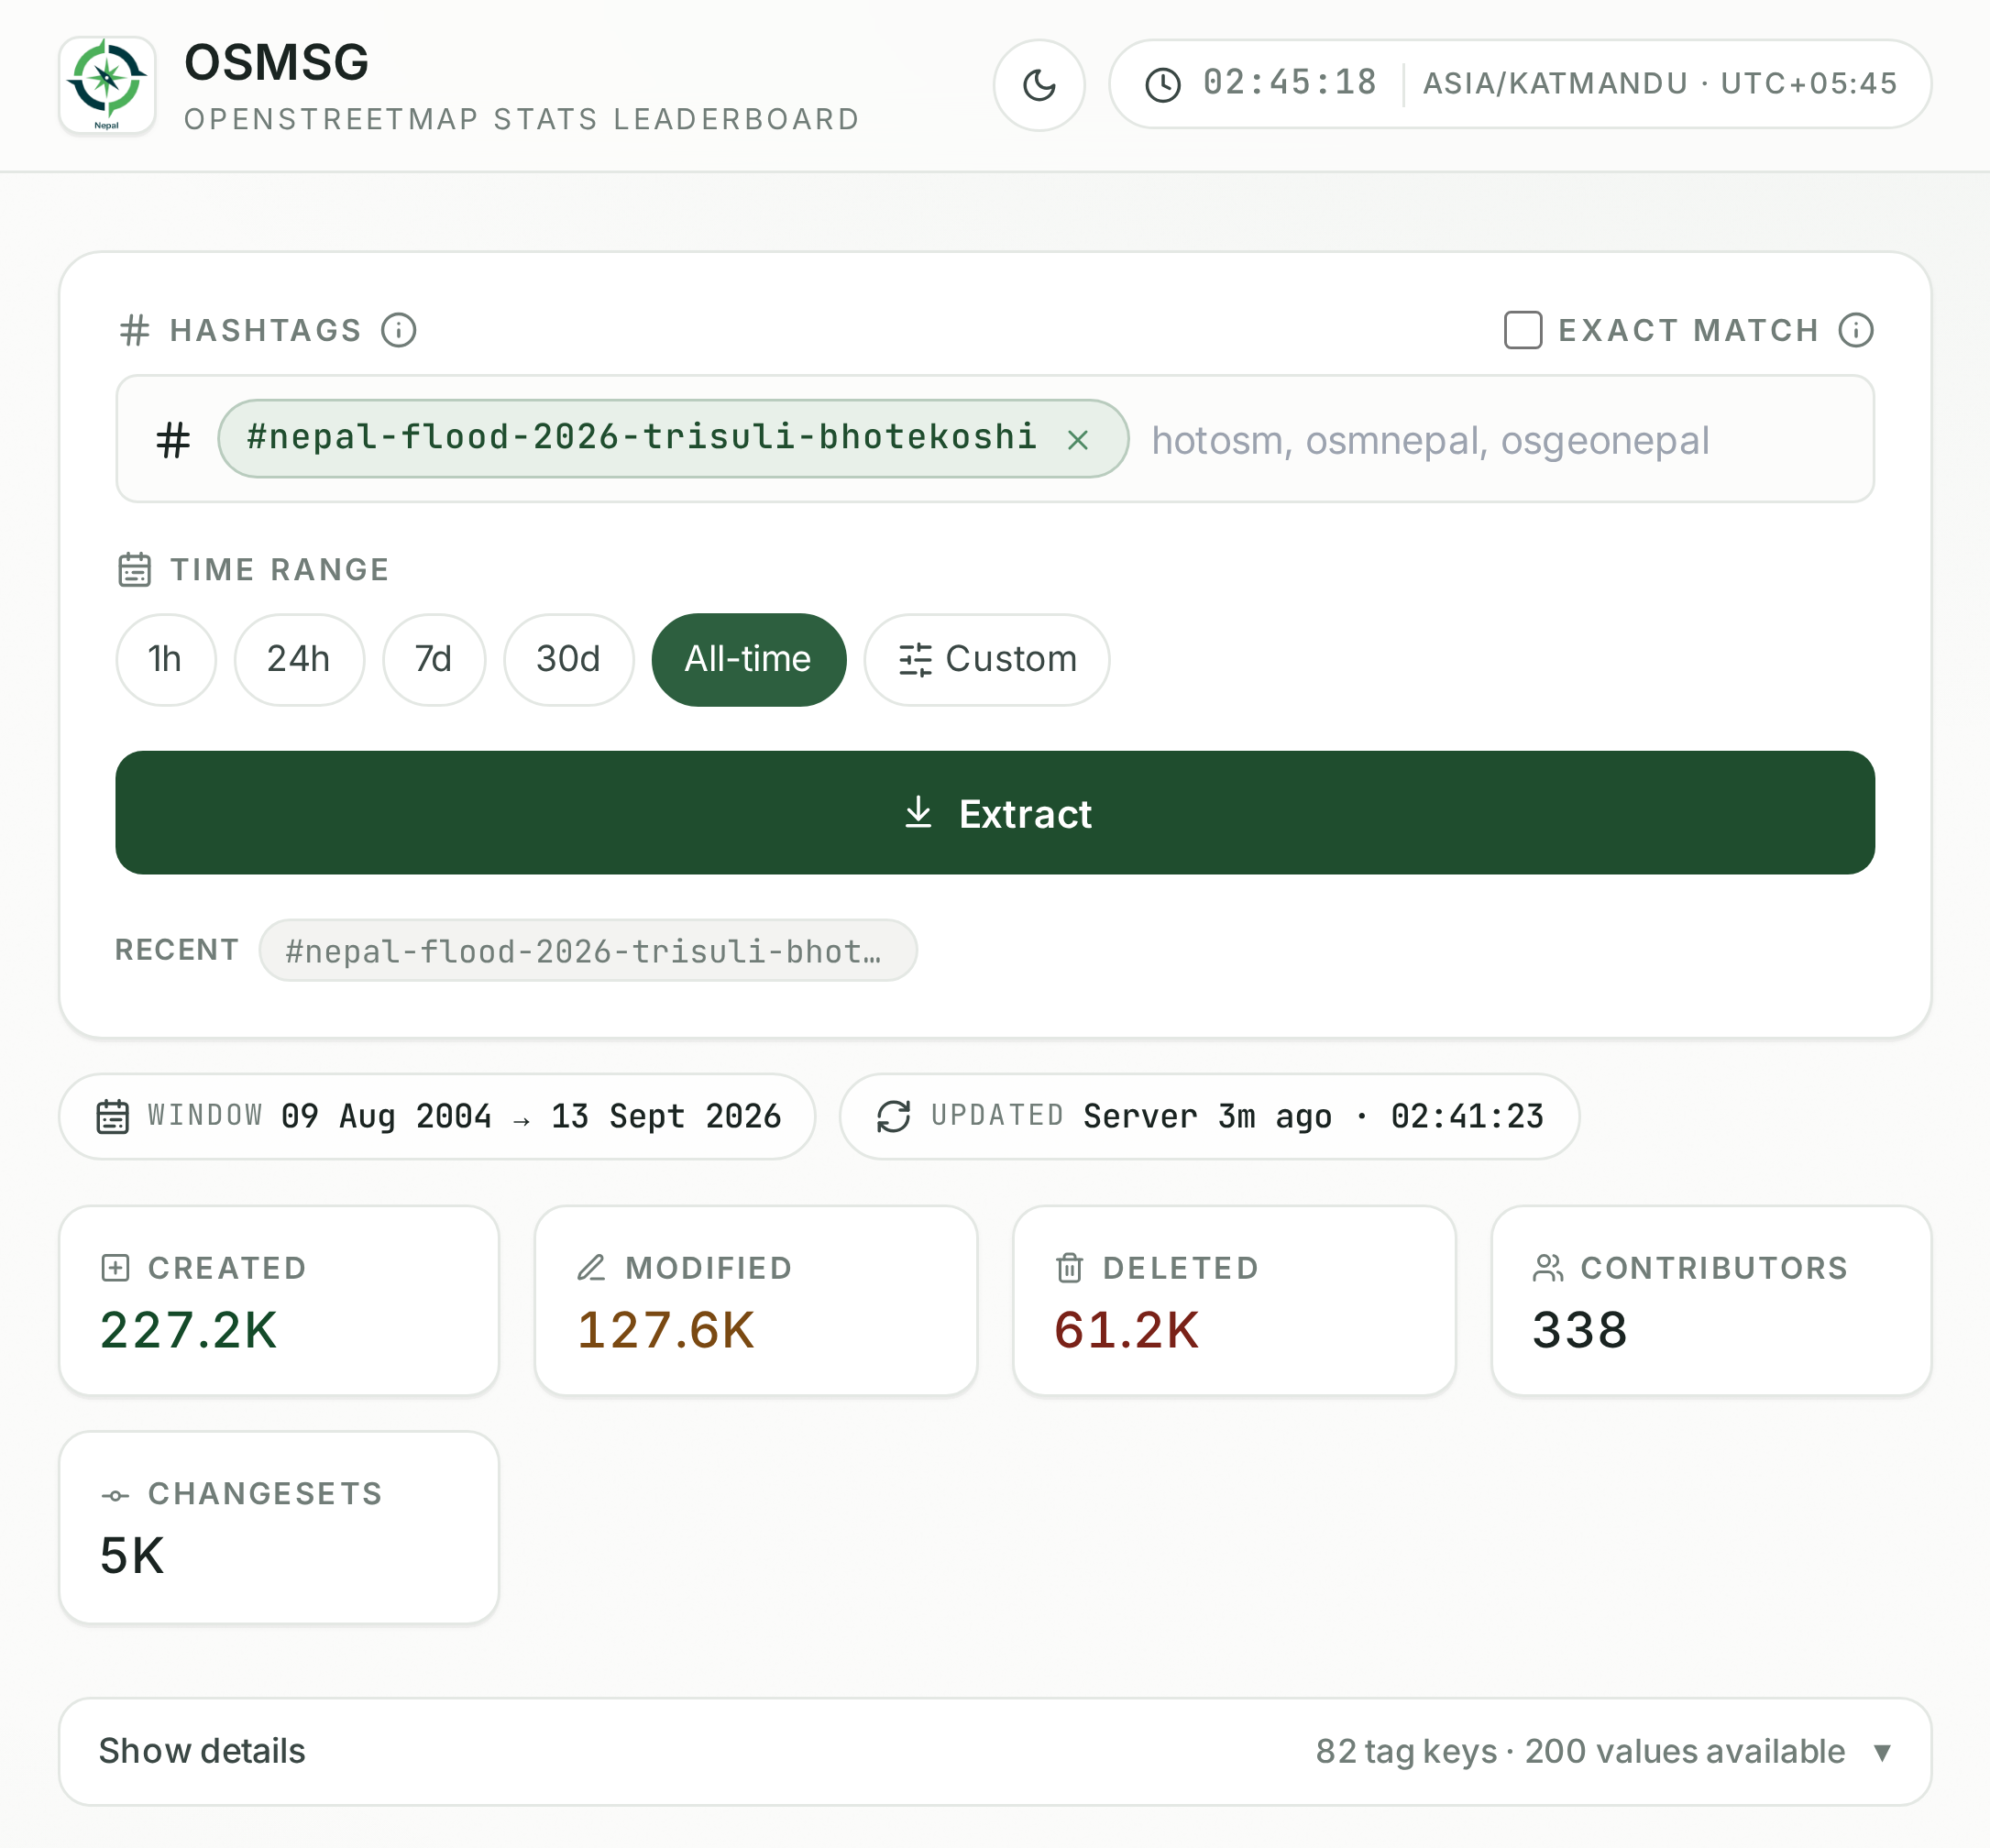
Campaign totals on osmsg.osgeonepal.org, 13 Sep 2026.
How it worked
Volunteers mapped from satellite imagery. fAIr models learned from that mapping: one found the buildings, the other scored the damage level per building. Volunteers then validated the the AI results.
- Imagery released: Vantor before and after images. Mappers traced mostly on Esri World Imagery in Tasking Manager.
- Volunteers map: Tasking Manager projects: buildings, roads, residential areas.
- Validators check: Mappers with more than 250 changesets, in vetted teams like HOT Global Validators.
- fAIr trains: Buildings mapped by volunteers in OpenStreetMap become training data for the AI models.
- Models predict: One model finds the buildings. A second scores the damage level for each mapped building.
- MapSwipe validates: Volunteers validate the 1,053 buildings in the first AI release, one at a time.
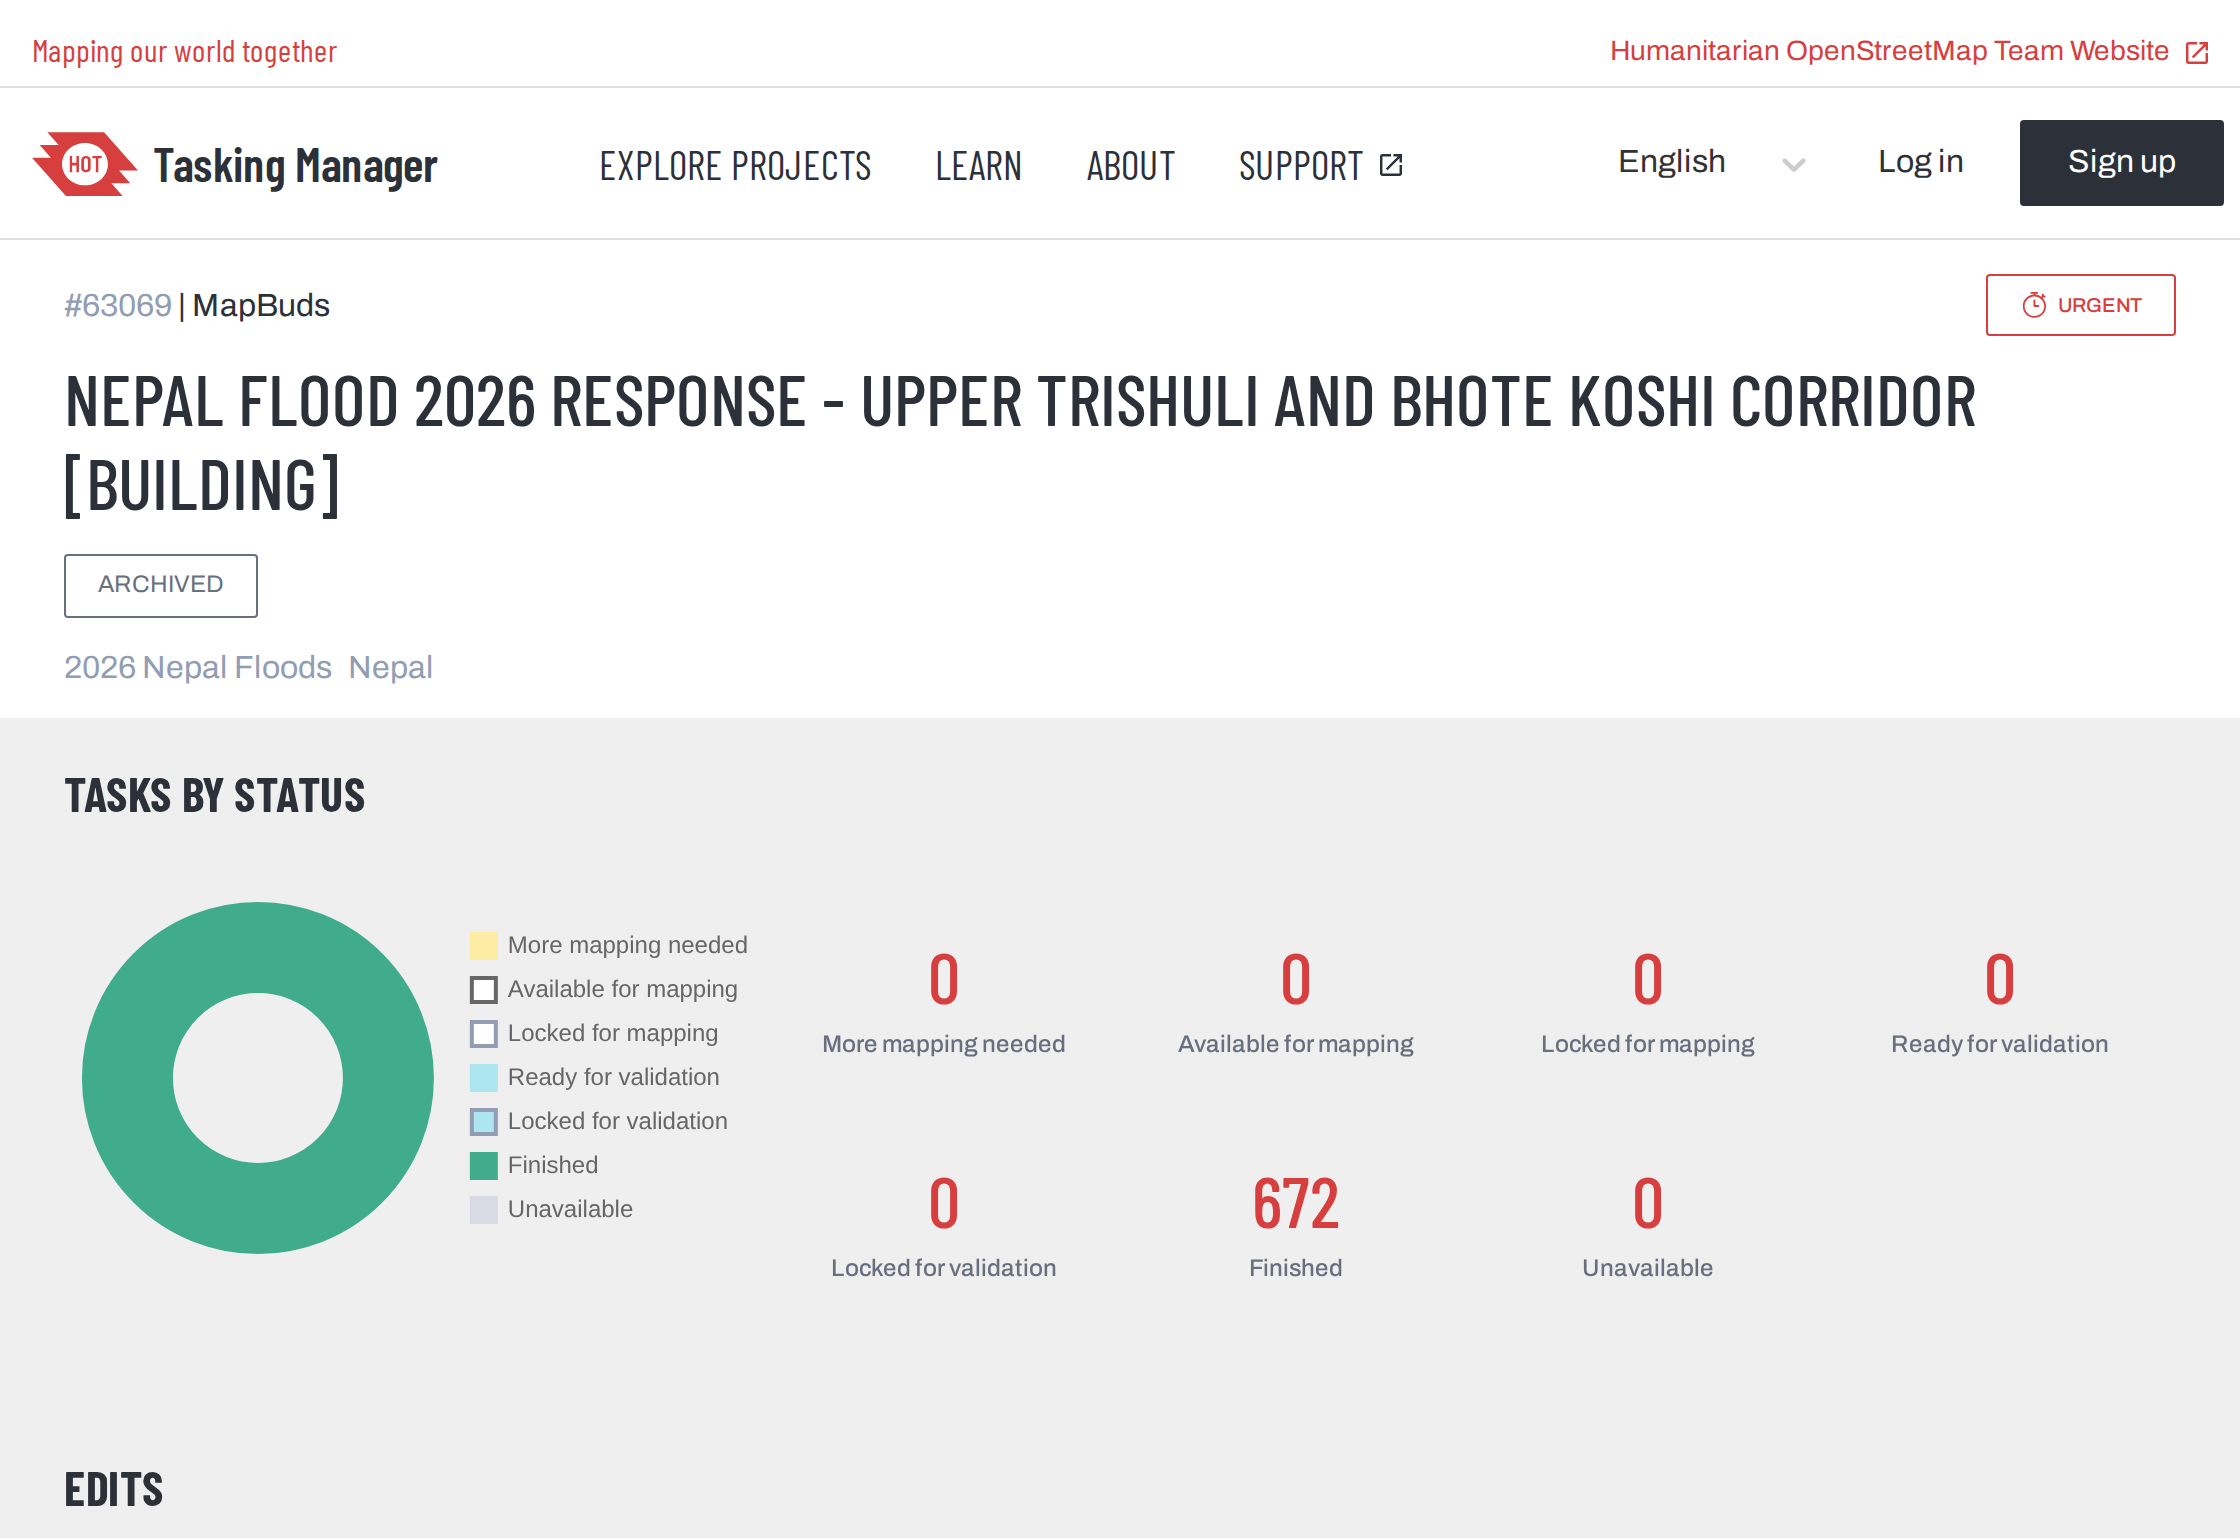
tasks.hotosm.org, project 63069, upper corridor buildings. All 672 tasks were completed, and 7 of the campaign’s 9 projects were 100% mapped and validated.
The response combined human mapping and validation with the fAIr model, using open data and imagery to support the mapping process. Mapped features are added to OpenStreetMap, while HOT rebuilds the corresponding layers on HDX every day.
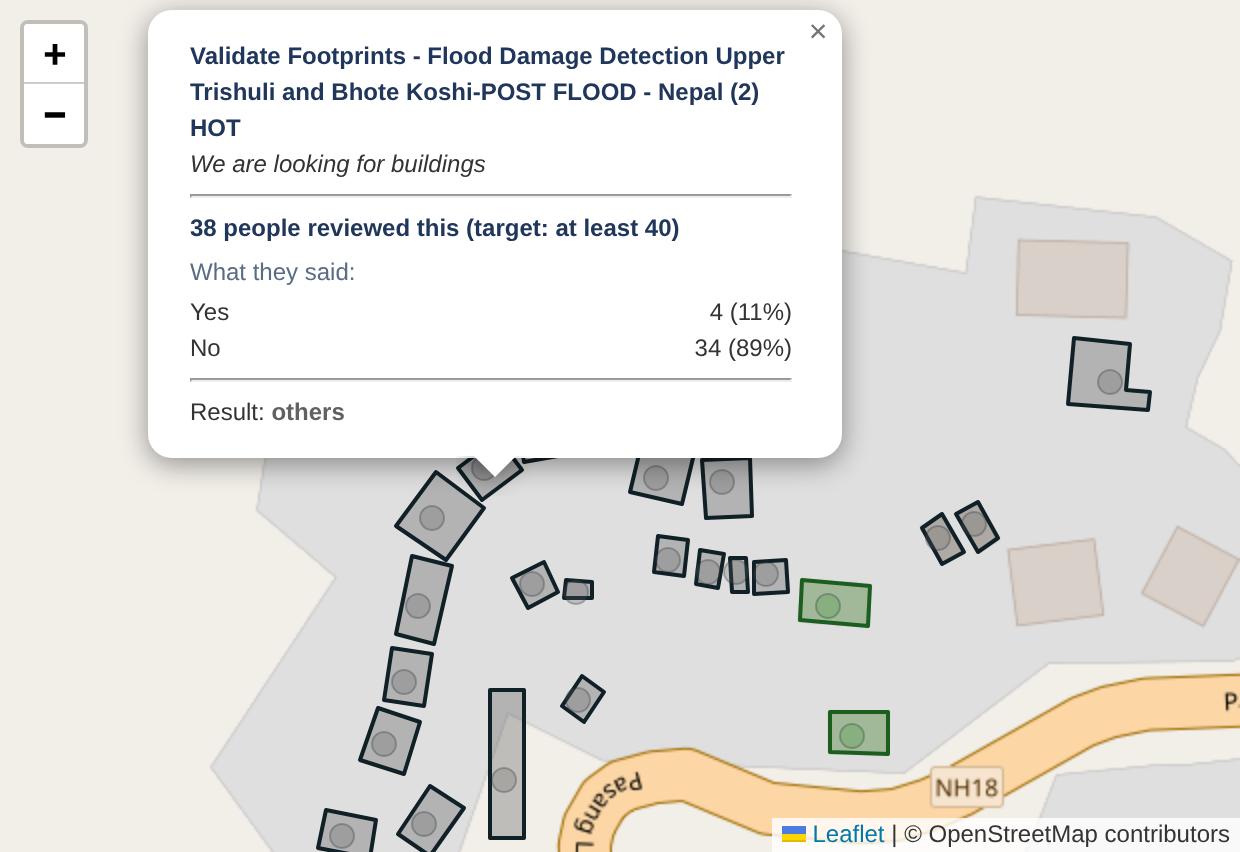
hotosm.github.io/mapswipe-results-analyzer, post flood project. Each building footprint was reviewed by dozens of volunteers, with the majority decision determining the result. .
How damage is recorded in OpenStreetMap: mappers keep the outline of a destroyed building, change building=yes to destroyed: building=yes, and add damage:event=2026 Nepal Flood. The building stays in the data as a record of the loss, and the HDX layers mark it Destroyed.
Two local models
Two models were developed for the Nepal response using buildings mapped manually by volunteers during the activation. One model was used to identify buildings from before-flood imagery, while the other assessed building damage using before-and-after imagery. Both models were developed and tested at dev.ai.hotosm.org/try-fair.
01 Buildings
Before flood imagery
- Base: DINOv3 (Meta) building model, the same base model available in fAIr
- Trained on: Buildings mapped by volunteers in OpenStreetMap, once the first Tasking Manager project was complete
- Predicted: Buildings across the whole northern priority area
- Released as: Building layer on HDX, archived once manual mapping was done
02 Damage
Before and after imagery
- Base: DINOv3 (Meta) siamese damage model, pretrained on xView and Venezuela earthquake damage data
- Trained on: 272 buildings labelled by expert mappers for the first release: 183 destroyed, 89 intact
- Predicted: On 28 August, 1,053 buildings were assessed using the first after-flood images. By 12 September, 8,421 buildings had been assessed across the 26-image after-flood composite: 2,276 were classified as destroyed, 594 as major damage, 1,049 as minor damage, and the remainder showed no visible damage.
- Released as: Nepal Flood 2026, fAIr Damage Assessment on HDX, first release 28 Aug, updated 12 Sep
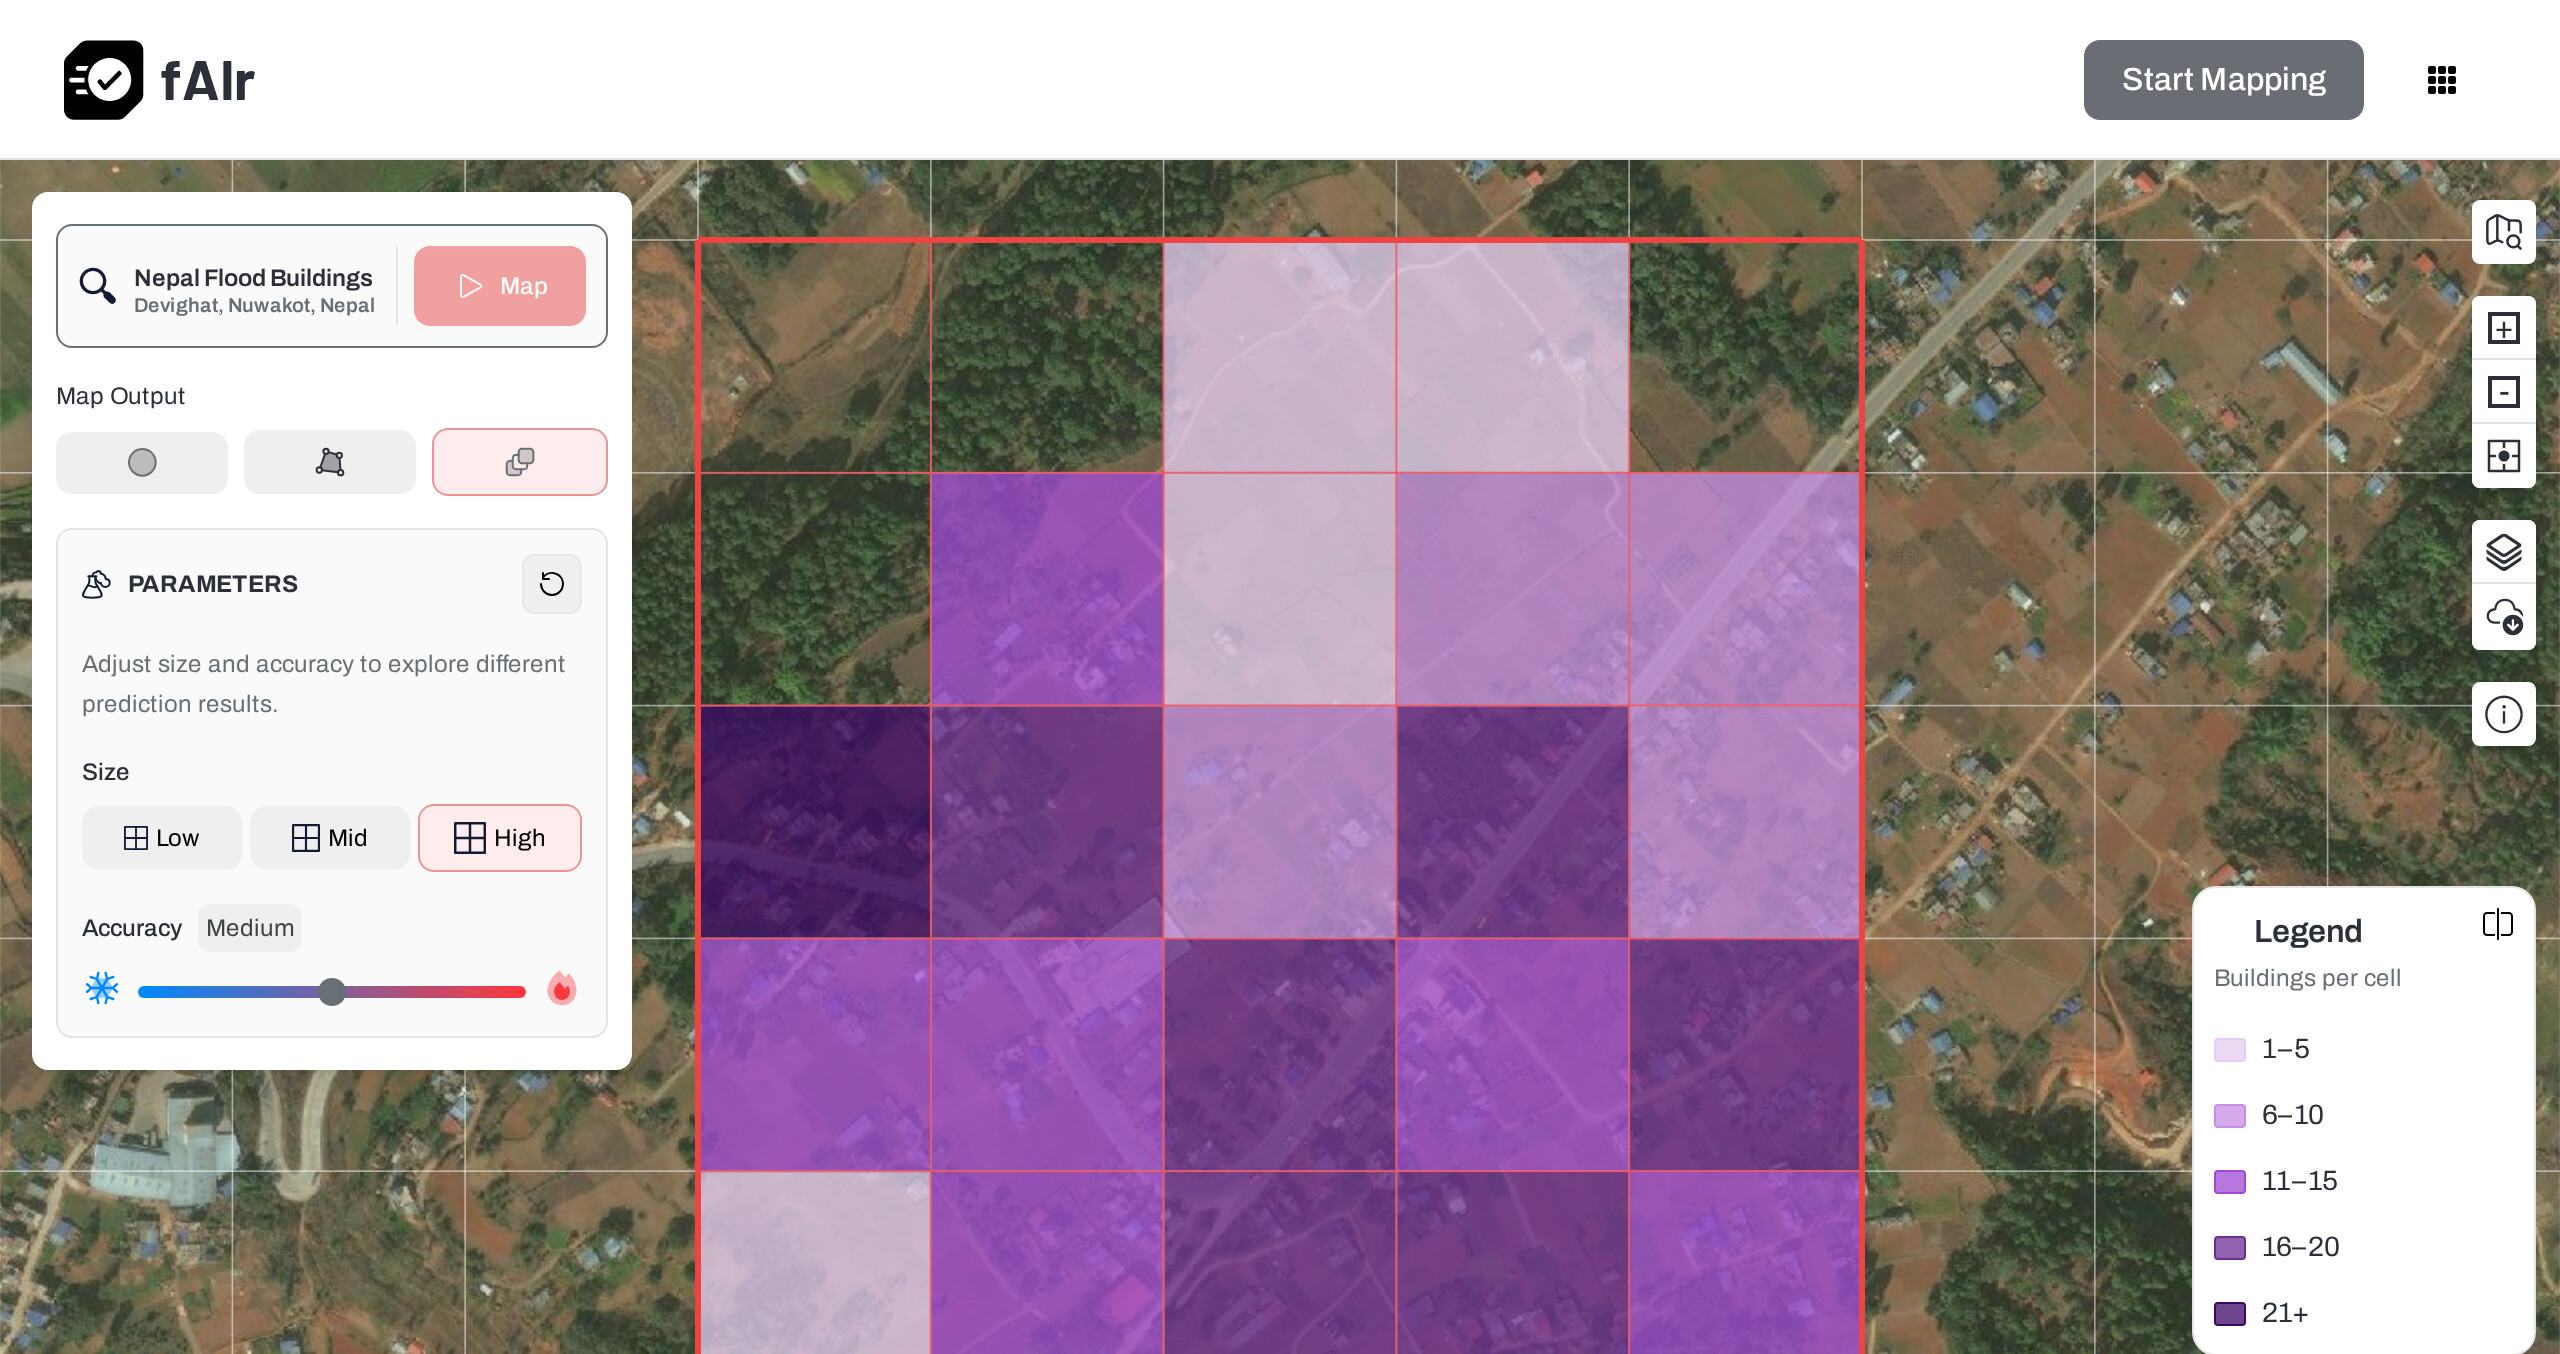
Nepal Flood Buildings on fAIr: predicted buildings per grid cell at Devighat, Nuwakot, using before-flood Vantor imagery (CC BY-NC 4.0).
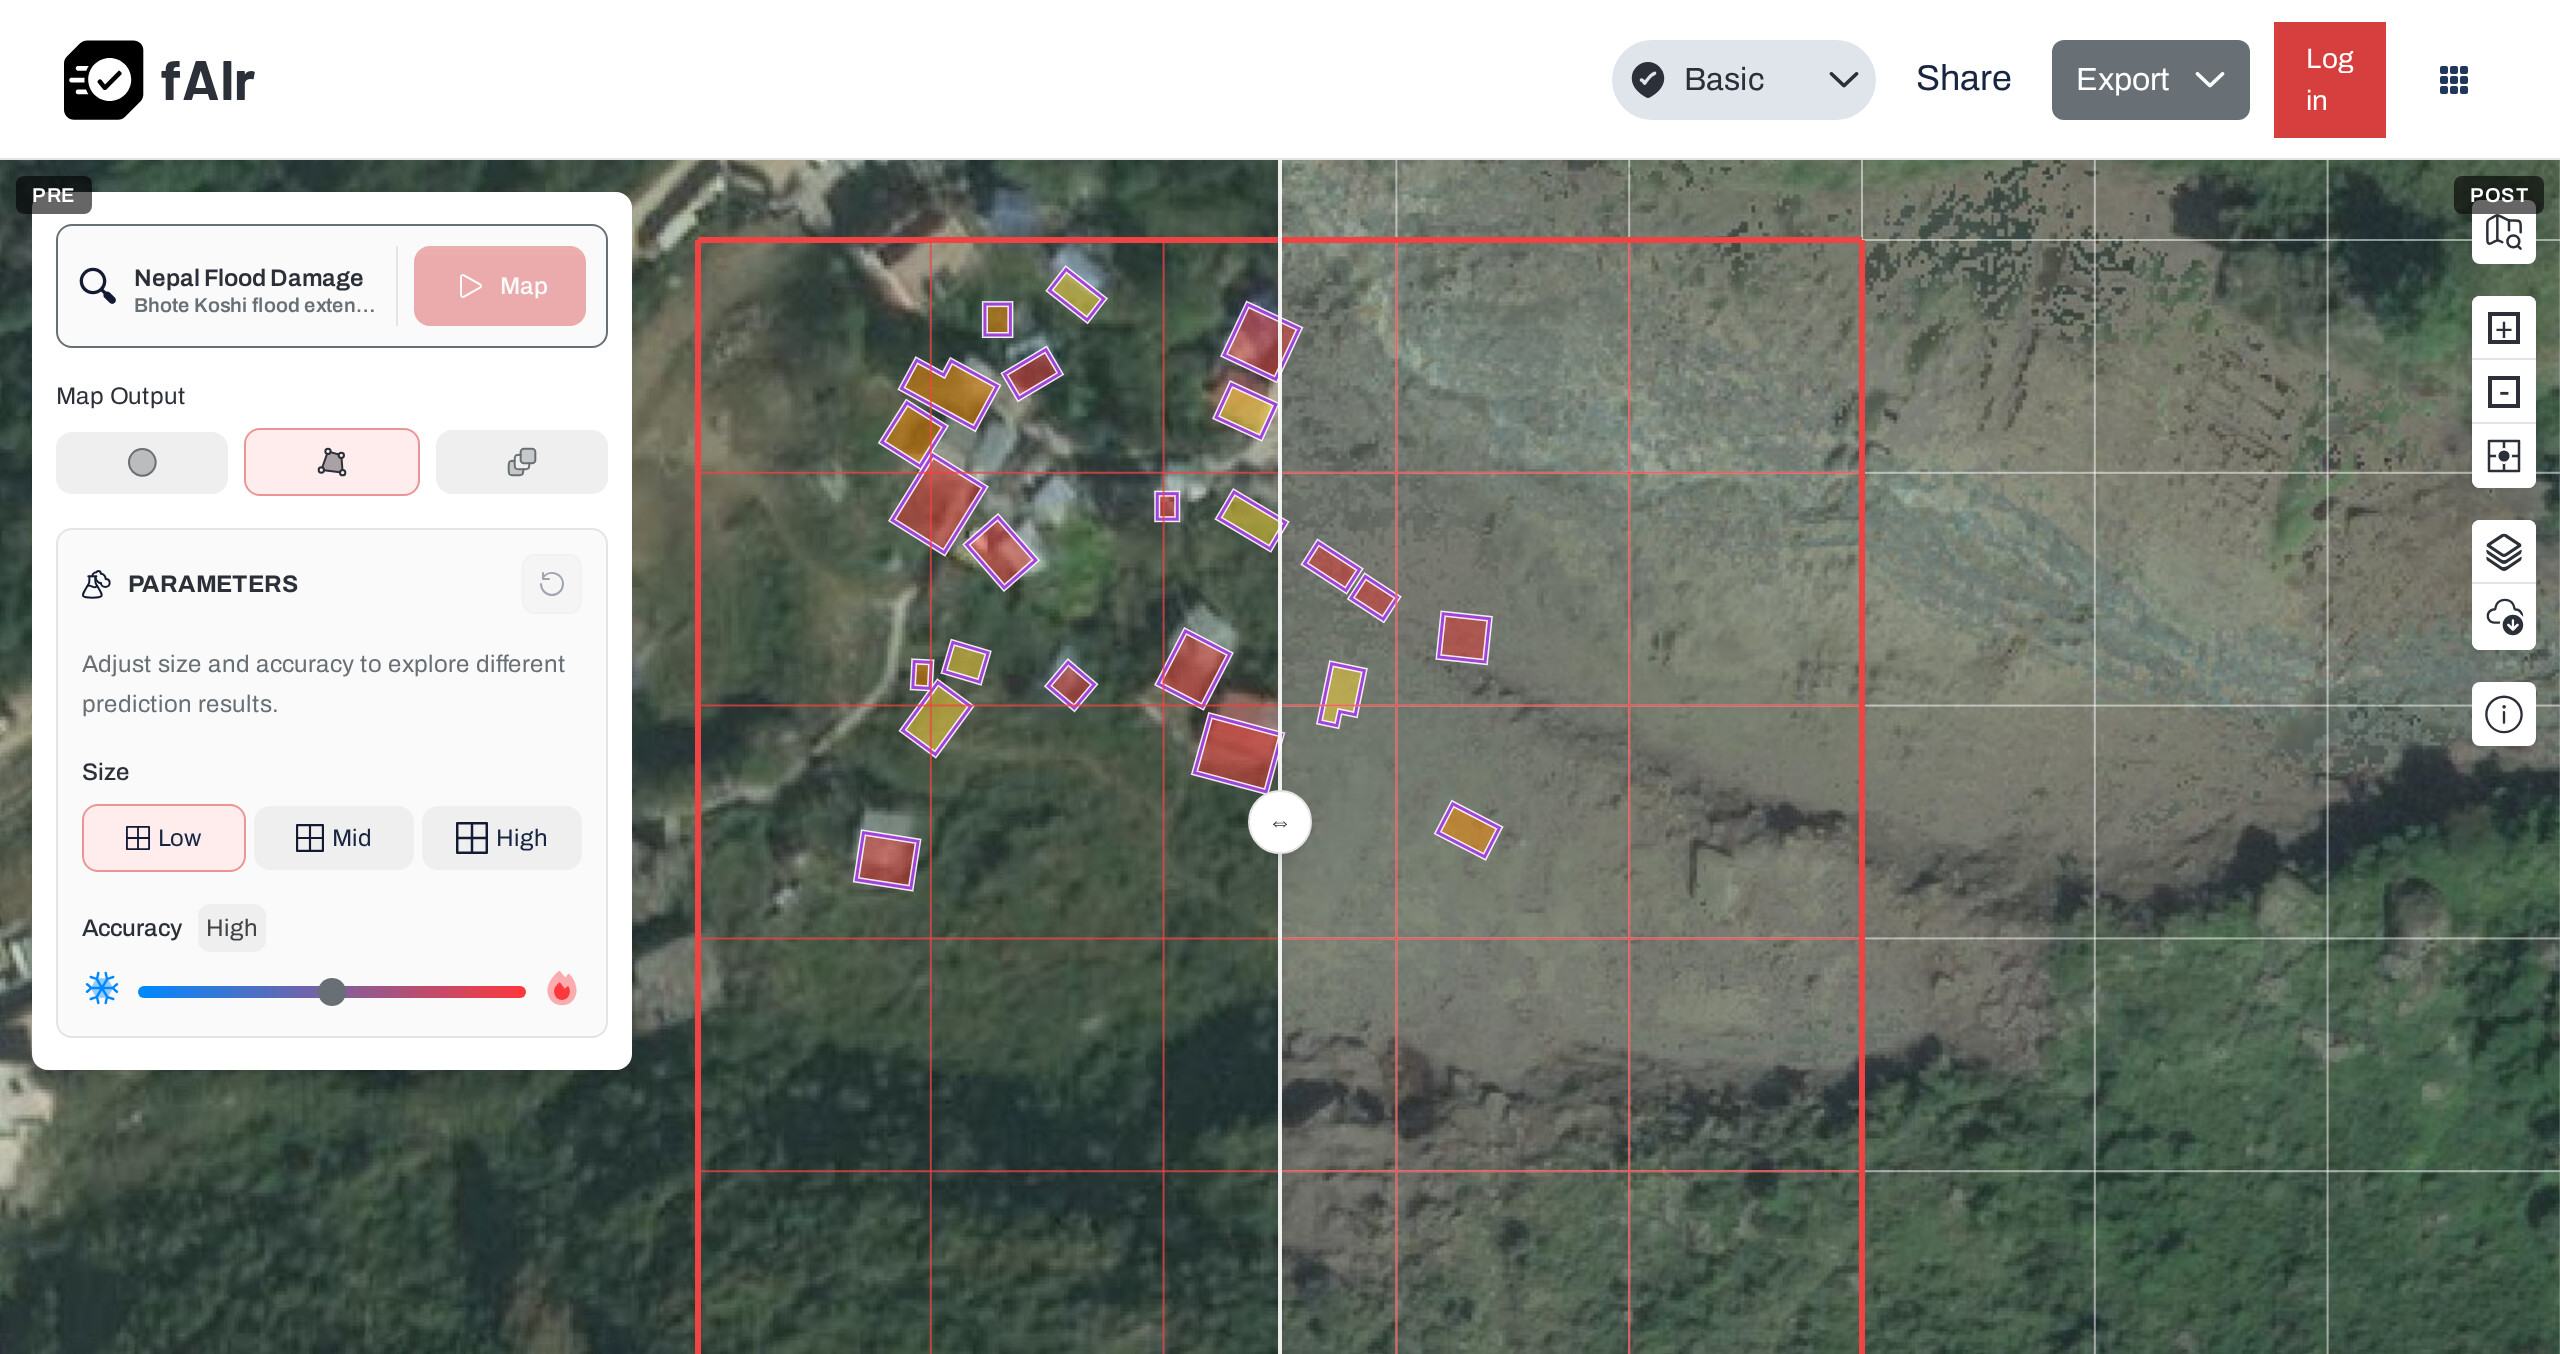
Nepal Flood Damage on fAIr, Bhote Koshi flood extent. Vantor imagery before (left) and after (right), CC BY-NC 4.0. Red: destroyed; orange: major damage; yellow: minor damage.
Cloud and mud made damage hard to read. In the worst-hit settlements buildings were buried in mud, and only 5 of 27 after-flood images were clear over the river. The AI results went out as predictions, 799 MapSwipe volunteers checked them, and the September update was measured against 3,896 buildings tagged by hand.
What exists and where
At HOT’s request, Vantor agreed on 27 August to release before-and-after imagery under a CC BY-NC 4.0 licence. The imagery covers 55 km² after the flood and 45 km² before the flood across the 90 km² high-risk area. Of the 27 available images, 5 were clear over the river, with imagery at a resolution of 35–72 cm/px and published on OpenAerialMap. Features traced into OpenStreetMap are distributed under the ODbL licence. The official government report for the disaster can be found here, where fAIr & HOT datasets has been credited.
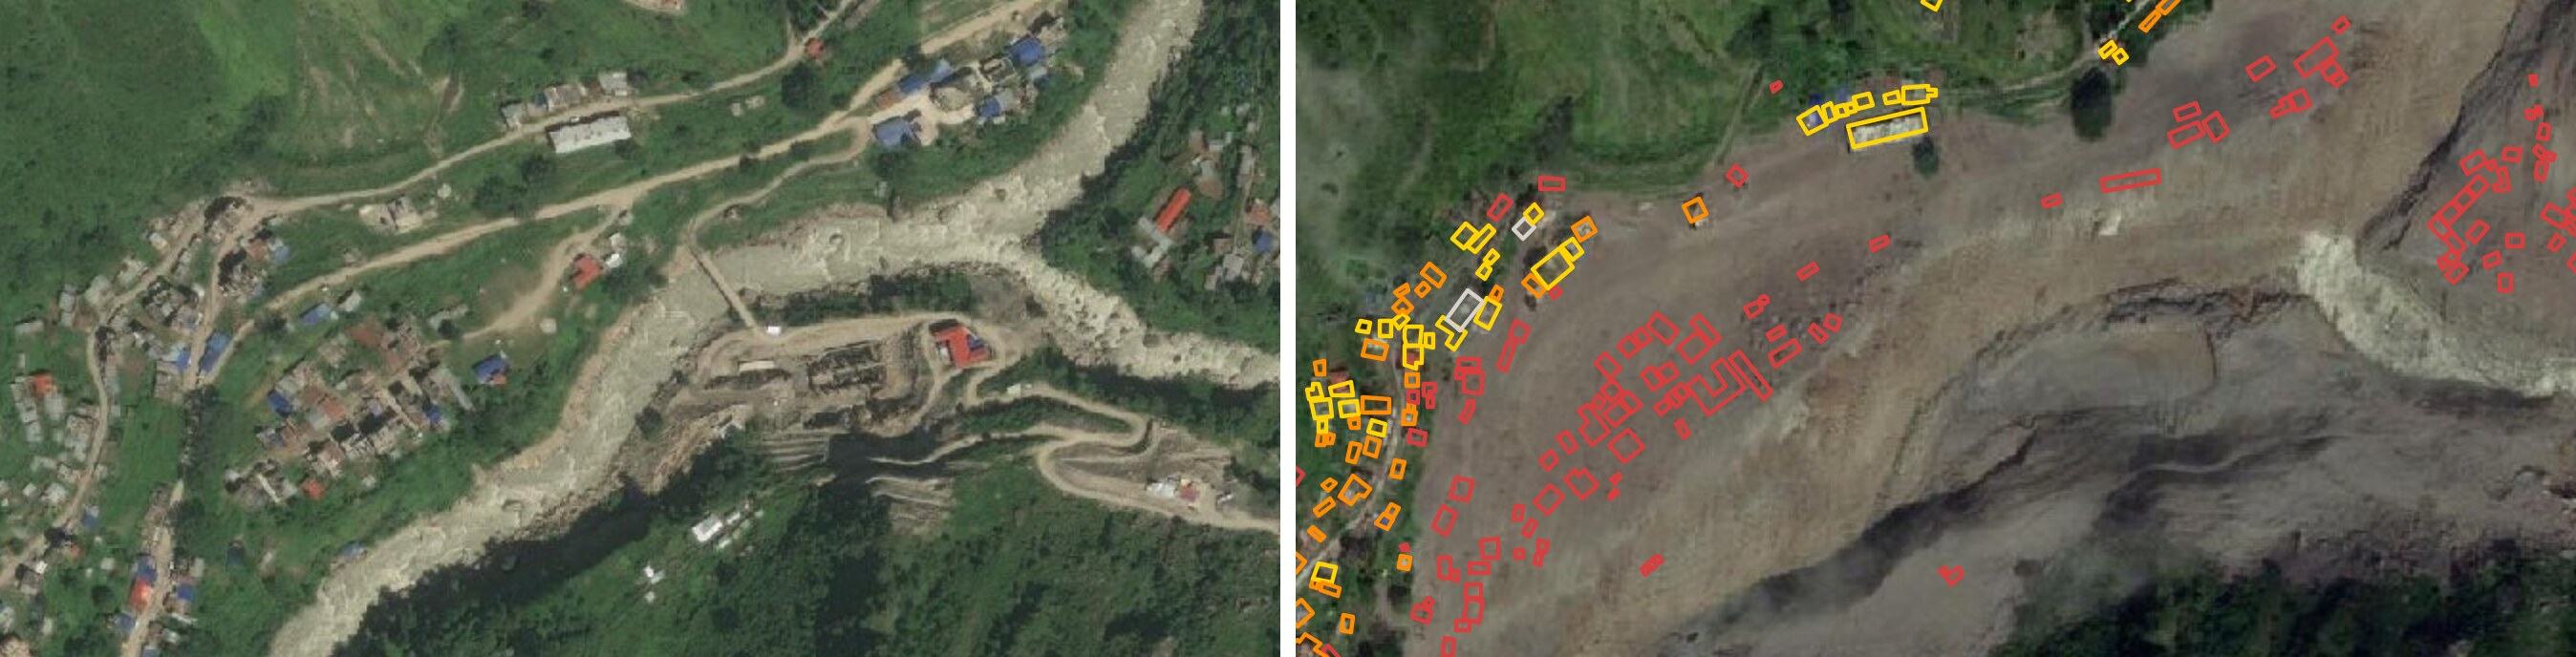
Syaphrubesi, before (Vantor, Sep 2023) and after, with fAlr damage classes: red destroyed, orange major, yellow minor.
Published datasets and services
- Flood extent plus 200 m: Updated daily
- 1 km river buffer: Merged with OCHA's HPCS corridor downstream and updated daily
- AI damage scores: Covers 8,421 buildings and is updated weekly
- OpenAerialMap: Images with capture dates
- Tasking Manager: All 9 campaign projects are now archived
- MapSwipe: 799 volunteers validated AI damage results
- Contribution statistics: Live total for the campaign hashtag
- Activation wiki: Imagery tables, mapping guides, and activation history
Share